


近日公司和美国赫能正在洽谈合作的事情,他们公司的老板Harry Arnon推荐了一篇关于胶粘剂市场的文章,抽空看了一下,公司的同事将其翻译成中文,与大家共享之。点击查看原文。 翻译的文章在英文后面:
The Global Formulated Adhesives Market
by Minesh Kusumgar
January 1, 2011
After years of uninterrupted growth, adhesive demand fell 5% in 2009 as the global recession took its toll. Global GDP declined by about 1% in 2009 and industrial production was off by nearly 3%. Formulated adhesive consumption in 2009 was 16.6 billion lbs (worth $20.6 billion). Volume is forecast to expand at a 4.5% annual rate through 2014 as the global economy rebounds. Growth in emerging economies will be robust, while modest increases in the mature economies of Europe and North America are forecast. Formulated adhesive consumption varies from over $12 per capita in the European Union and North America to less than $3 per inhabitant in China, India, and Brazil.
Regional Overviews
|
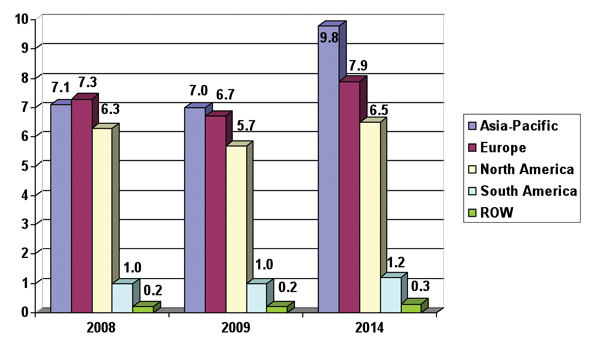
The Asia-Pacific region is the largest consumer of formulated adhesives; it achieved 40% of the 2009 volume and 34% of the dollars. Regional volume was up slightly in 2009 compared to the prior year, while the sales value was slightly lower. China is the largest consumer in Asia-Pacific with 53% of the volume and 49% of the value. Chinese adhesive consumption was up 6% in 2009 as the domestic economy expanded, despite weak export demand for its manufactured products. A robust 9% annual rate of growth is forecast for adhesives in China.
Japan, the second-largest market for adhesives in the region, took 16% of the 2009 volume and one-fifth of the dollars. Volume in Japan declined significantly compared to 2008, and lackluster growth is forecast. India is a smaller user of adhesives, with 6% of the regional volume and 5% of the value. Like China, it is one of the few countries in the world to have experienced modest adhesive growth in 2009. Adhesives in India are projected to expand 11% per year through 2014.
Europe is the second-largest regional consumer of formulated adhesives, with 30% of the world’s volume and 32% of the value in 2009. Europe had been the leader in adhesive dollars prior to 2009. The sharp decline in European consumption allowed the Asia-Pacific region to capture the lead, which is projected to widen in future years. A 3% annual growth rate is forecast for European adhesives, with Eastern European countries expanding somewhat faster than Western Europe. European Union members consumed about 93% of the adhesive dollars.
North America took 24% of the global adhesive volume in 2009 and 27% of the dollars. As was the case in Europe, the market declined significantly from 2008. The U.S. consumed nearly 90% of the regional total, with the rest about equally split between Canada and Mexico. A modest 3% annual rate of growth is forecast for North American adhesive volume. South and Central American countries consumed 5% of the global adhesive volume and dollars in 2009. Brazil is the leading regional consumer with 57% of the value. Brazil weathered the global recession better than most, with adhesive volume only down 2% in 2009. South and Central American adhesives are projected to advance 5% annually through 2014.
Figure 1 shows adhesive dollar consumption by region in 2008 and 2009, as well as the 2014 forecast.
End Use Review
|

Pressure-sensitive products are the largest adhesive end use, representing 28% of the global volume in 2009 and 25% of the value. Applications include tapes, labels, decals and a host of other specialty products. Over 45 billion m2 of product is adhesive-coated, with tapes comprising over 60% of the total. Two-thirds of the adhesive value is produced in-house by pressure-sensitive product manufacturers. Pressure-sensitive adhesives are forecast to grow 5% annually through 2014, with emerging economies (China, India, Brazil, etc.) expanding faster.
Packaging is the second-largest end use, with 22% of the volume and 18% of the dollars in 2009. Global volume was down only slightly from the prior year and a 4% annual rate of increase is forecast. Flexible packaging is a higher value segment that represents one-quarter of the packaging adhesive dollars in 2009. Construction was the third-largest adhesive outlet in 2009, with 16% of the volume and 10% of the dollars. Construction adhesive applications include ceramic tile and flooring installation, pipe cements, roofing, wall coverings, etc. Volume was down more than 10% compared to 2008, as activity declined significantly in the mature economies.
Woodworking is the fourth-largest end use, taking 11% of the 2009 volume and 8% of the dollars. Wood furniture is a leading application, and global production suffered the effects of the recession. The automotive industry is the fifth-largest end use in dollars, with a 6% share despite representing only 2% of the dollars. Adhesives consumed by car and truck manufacturers are included, as well as those used in the aftermarket. Global vehicle production was 61 million units in 2009, which was down 13% compared to 2008. Steep declines occurred in Europe and North America. In contrast, production in Asia-Pacific remained about the same as output surged in China. Some 810 million vehicles are on the world’s roads, with adhesives used by both the professional and consumer. Excluded from automotive adhesives are windshield sealants, a nearly $600 million market in 2009, as well as several other sealant types.
The five largest adhesive applications took 80% of the adhesive volume in 2009 and two-thirds of the value. Figure 2 shows adhesive consumption by end use in dollars for 2009. Electronics, bookbinding, and aerospace are larger end uses in the “other” category.
Adhesive Technologies
|
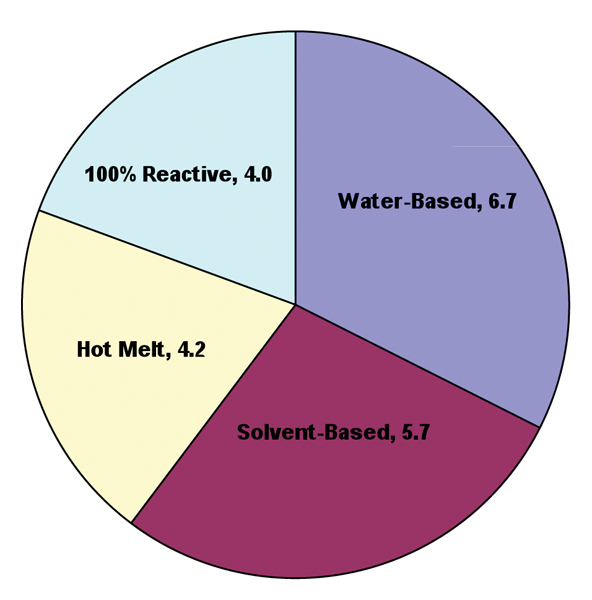
Figure 3 summarizes the four major adhesive technologies in value for 2009. Water-based adhesives are the leading type, with $6.7 billion consumed (33% of the global adhesive sales dollars). Water-based adhesives are generally lower in cost and they represented over one-half of the 2009 pounds.
Solvent-based technology is second in dollars, with its $5.7 billion (28%) of the value. Hot-melts were third, representing one-fifth of the dollars, with packaging and disposable products leading outlets. The 100% reactive category was slightly behind hot-melts in dollars, with a 19% share. These products are generally the highest priced adhesives, and they captured only 4% of the volume. Epoxy, polyurethane, cyanoacrylate, anaerobic, structural acrylic, etc. products are included.
Adhesive Types
|
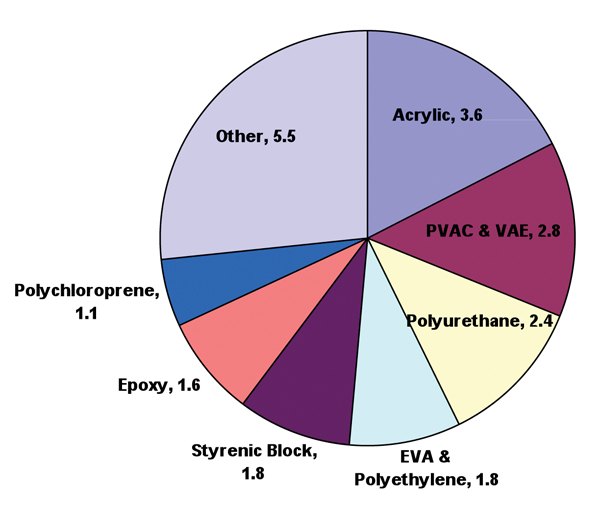
Adhesives employ a host of polymer types in their formulation. Sales of the leading adhesives by polymer type in 2009 are shown in Figure 4. Acrylics are topmost, with their $3.6 billion in sales representing a 17% share. Acrylic emulsion-based formulations were 72% of the dollars and solvent-based acrylics accounted for 23%. Smaller amounts of structural acrylics and radiation-cured hot-melts are used. Water-based polyvinyl acetate (PVAC) and vinyl acetate-ethylene (VAE) adhesives comprised 14% of the adhesive dollars. Woodworking and packaging are the larger outlets.
Polyurethane adhesives were 12% of the sales and are formulated using each of the four major technologies. Solvent-based formulations were one-half of the polyurethane dollars, with flexible packaging and footwear the largest applications. The 100% reactive polyurethanes were about one-third of the dollars, with flexible packaging and automotive its major outlets. Hot-melt polyurethanes were 10% of the sales and water-based formulations another 7%.
Ethylene-vinyl acetate (EVA) and polyethylene hot-melts were 9% of the adhesive dollars in 2009, as were styrenic block copolymer hot-melts. Packaging is the major user of EVA and polyethylene hot-melts. Some 95% of the styrenic block copolymer adhesives are used in pressure-sensitive products and disposable products (diapers and other).
Epoxy adhesives are used in several higher dollar value end uses, which include the electronic, aerospace and automotive industries. Polychloroprene adhesives are largely solvent-based, although water-based versions have gained share in recent years. Footwear, woodworking and construction are the larger outlets. Larger dollar value adhesives included in “other” are cyanoacrylate, anaerobic, rubber, starch and dextrin, polyester, and polyamide.
Competitive Outlook
Acquisitions continue to alter the adhesive supplier structure. In 2009, the top 20 formulated adhesive suppliers captured 47% of the sales value. These companies sold about 55% of the adhesives in North America, Europe, and South and Central America. Their share in the Asia-Pacific region was only about one-third of the total, but it is expected to rise.
Many adhesive suppliers augment their sales with related products, which can include sealants, binders, construction products, electronic potting and encapsulating compounds, coatings, etc. Although the supplier base in large-volume end uses is concentrated, the wide range of end users, applications and technologies yields thousands of suppliers and an environment where novel technologies thrive.
The above information is based on The Global Adhesives Industry, a new study by Steven Nerlfi, Minesh Kusumgar, and Michael Growney. For more information, phone (201) 773-0785, e-mail nerlfikng@cs.com or visitwww.kusumgar-nerlfi-growney.com.
在多年销售的不断增长后,胶粘剂需求量在2009年的全球萧条中下跌5% 。2009年,全球GDP下降约1%,工业产品下跌近3% 。预计2009年胶粘剂的消耗量是166亿磅(206亿美元)。随着全球经济的复苏,预计到2014年,胶粘剂的需求量将达到4.5%的年增长率。在欧洲和北美的成熟经济体的缓慢增长的同时,新兴经济体的增长将非常强健。预计在欧盟和北美每人超过$12的胶水需求量,在中国、印度、巴西将降至每户不足$3。
地区概述
Figure 1. Adhesive Consumption by Region($ Billion)
亚太地区是预计胶粘剂的最大消费体;其消耗量在2009年达到总量的40%,总消费金额的34% 。当2009年的总销售额轻微下降时,该地区消耗量较上年却有轻微上涨。中国拥有53%的消耗量,占总销售额的49%,是亚太地区最大的胶水消费者。尽管对其产品的出口需求量偏弱,但中国胶水的消耗量在2009年的国内经济扩张中仍然增长6% 。预计中国胶粘剂需求量将有9% 的稳健增长量。
日本,该地区胶粘剂的第二大需求量国家,占2009年总消耗量的16%,占总销售额的1/5。相比2008年,日本需求量大幅度降低,前景预计不佳。印度为胶水小用户,占地区用量的6%,总销售额的5% 。中国是全球仅有的几个在2009年胶水用量有些微增长的国家之一。印度的胶水用量预计在2014年达到11%的年增长率。
欧洲是预计胶水的第二大消费地区,2009年占世界总需求量的30%,总销售额的32% 。2009年之前,欧洲是胶水销售额的领跑者。欧洲胶水消耗量的大幅下跌使得亚太地区可以趁机追赶,预期在未来几年内扩展销量以获取领跑地位。预计欧洲胶水将有3%的年增长率,东欧国家增长速度略大于西欧国家。欧盟成员约占欧洲总胶水销量的93% 。
北美在2009年占全球胶水用量的24%,总销售额的27% 。与欧洲市场一样,北美市场大幅较2008年大幅下跌。美国消耗量达到整个地区近90%,余下的需求量由加拿大和墨西哥均分。预计北美的胶水需求量将有3%的缓慢增长。2009年,南美和中部国家消耗量占全球消耗量和销售额的5% 。巴西是该地区的领跑者,占总量的57%。在2009年的全球经济萧条中,巴西比大多数国家更经得起风霜,胶水需求量仅下降了2% 。预计南美和中美洲在2014年的胶水需求量将达到5%的年增长率。
图1标示了2008-2009年地区的胶水销售额,以及2014年的预计销售额。
最终用途概述
Figure 2. Adhesive Consumption by End Use, 2009. ($20.6 Billion Total)
压敏产品是胶水的最大应用点,占2009年全球总量的28%,总销售额的25% 。应用包括:胶带、标签、贴花纸,以及许多其他特有产品。超过450亿产品需要涂胶,包括胶带在内,占总量比例超过60% 。2/3的胶水销售量是由压敏产品生产商在室内生产的。随着新兴经济体(中国、印度、巴西等)的快速扩张,预计2014年压敏胶粘剂将达到5%的年增长率。
包装是胶水终端用途的第二大应用点,在2009年,占总销售量的22%,总销售额的18% 。全球需求量较前年仅轻微下调,预计将有4%的年增长率。软包装是高产值部分,在2009年占包装用品胶水销售量的1/4.结构胶属于包装用胶第三大胶水需求点,占2009年总需求量的16%,总销售额的10% 。结构胶应用包括瓷砖和地板的安装、管道粘接、房顶及墙面涂胶等。结构胶在成熟经济体中的需求量大幅下跌。相比2008年,需求量下跌了不只10%。
木工艺是终端用途的第四大模块,占2009年总需求量的11%,总销售额的8%。木制家具是领头应用点;全球生产也受到了经济萧条的影响。汽车工业是终端应用的第五大模块,占全球需求量的6%,全球销售额的2% 。该模块包括汽车、卡车生产商的胶水消耗量,已经用于售后的消耗量。2009年,全球的交通工具产品达到6100万单位,相比2008年下降了13%。欧洲、北美地区遭受急剧下降。相反,亚太地区与中国同样保持大批量产量。大概8.1亿的交通工具已投入到世界的道路上,意味着胶水在被专业生产及非专业用户同时使用着。不包括从汽车挡风玻璃密封胶,在2009年有近6亿美元的市场,以及其他一些类型的密封胶。
这五个最大的胶粘剂应用点占据了2009年胶水需求量的80%,占销售额的2/3。图2标示了2009年终端应用的胶水消耗量(美元)。电子、装订,及航天是更大的另一类终端应用点。
胶水技术
Figure 3. Adhesive Consumption by Technology, 2009($20.6 Billion Total)
图3总结了2009年销量的4个主要胶粘剂技术。水基粘合剂是领头类,达67亿美元的消耗量(全球胶水销售量的33%)。水基粘合剂通常价格较低,占2009年英镑销售的一半以上。
溶剂型技术是销售额中的第二大技术,达57亿美元的销售量(占28%)。热熔型占第三,占总销售额的1/5,包括包装及一次性产品领先的行业。100%的活性类占比微次于热熔型,占19%份额。这些产品通常是价格最高的,只占取了总量的4%。包括环氧树脂、聚氨酯甲酸乙酯、厌氧胶、结构丙烯酸树脂等产品。
胶水类型
Figure 4. Adhesives Consumption by Type, 2009($20.6 Billion Total)
胶水的配方中,有许多是聚合型产物。图4中列出了2009年销售领先的聚合型胶水。丙烯酸酯占首位销售,达到36亿美元,占17%份额。丙烯酸酯乳液型配方占该份额的72%,溶剂型丙烯酸酯占23%。结构型丙烯酸酯和辐射固化热熔型的使用量占更少的份额。水性乙烯聚醋酸酯(PVAC)和乙烯醋酸乙烯酯(VAE)粘合剂占占该份额的14%。木工艺和包装行业有更大的市场前景。
聚氨基甲酸乙酯粘合剂占销售额的12%,可用4个主要技术中的任何一个来配置。溶剂型配方占聚氨基甲酸乙酯销售额的一半,最常用于软包装和鞋产品。所有的活性聚氨基甲酸乙酯占总销售额的1/3,主要应用于软包装盒汽车业。热熔型聚氨基甲酸乙酯占销售额的10%,水性配方占7% 。
乙烯醋酸乙烯酯(EVA)和聚乙烯热熔型占2009年胶水销售量的9%,与热熔型苯乙烯类嵌段共聚物一致。乙烯醋酸乙烯酯(EVA)和聚乙烯热熔型最常用于包装。大概95%的苯乙烯类嵌段共聚物粘合剂都用于压敏产品和一次性产品。(尿布及其他)
环氧树脂粘合剂用于一些高价值终端产品,包括电子、航天及汽车工业。聚氯丁烯粘合剂多是溶剂型;近年来水性产品也获取了一些市场。主要应用于鞋产品、木工艺及建筑业。在其他行业占更大份额的粘合剂包括:氰基丙烯酸酯胶粘剂、厌氧胶、橡胶、淀粉-糊精粘合剂、聚酯以及聚酰胺。
外部竞争
跨国并购继续改变着胶水供应商的结构。2009年,前20个胶粘剂配方供应商占取了总销售额的47% 。这些公司销售了55%的粘合剂到北美、欧洲、南美及中美洲。他们在亚太地区仅占约1/3,但预计可上升。
很多粘合剂销售商通过销售相关产品增加其销售额,包括密封剂、装订机、结构产品、电子封装、以及包胶化合物、涂层等。尽管这些供应商基于大量终端应用的集中性,大范围的终端应用商、应用点和技术领域仍产生了成千的供应商,并生成了新兴技术盛行的环境。
以上信息基于新调查结果The Global Adhesives Industry(全球粘合剂工业),作者是Steven Nerlfi, Minesh Kusumgar, and Michael Growney。如需更多信息,可致电:(201)773-0785. E-mail: nerlfikng@cs.com 或访问网站 www.kusumgar-nerlfigrowney.com .


I’m curious to find out what blog system you are utilizing? I’m having some minor security problems with my latest site and I would like to find something more risk-free. Do you have any suggestions?